Formal role for children and young people · 65 people answered
01 · Common ground
Common ground is about how policy should work—not one preferred ban
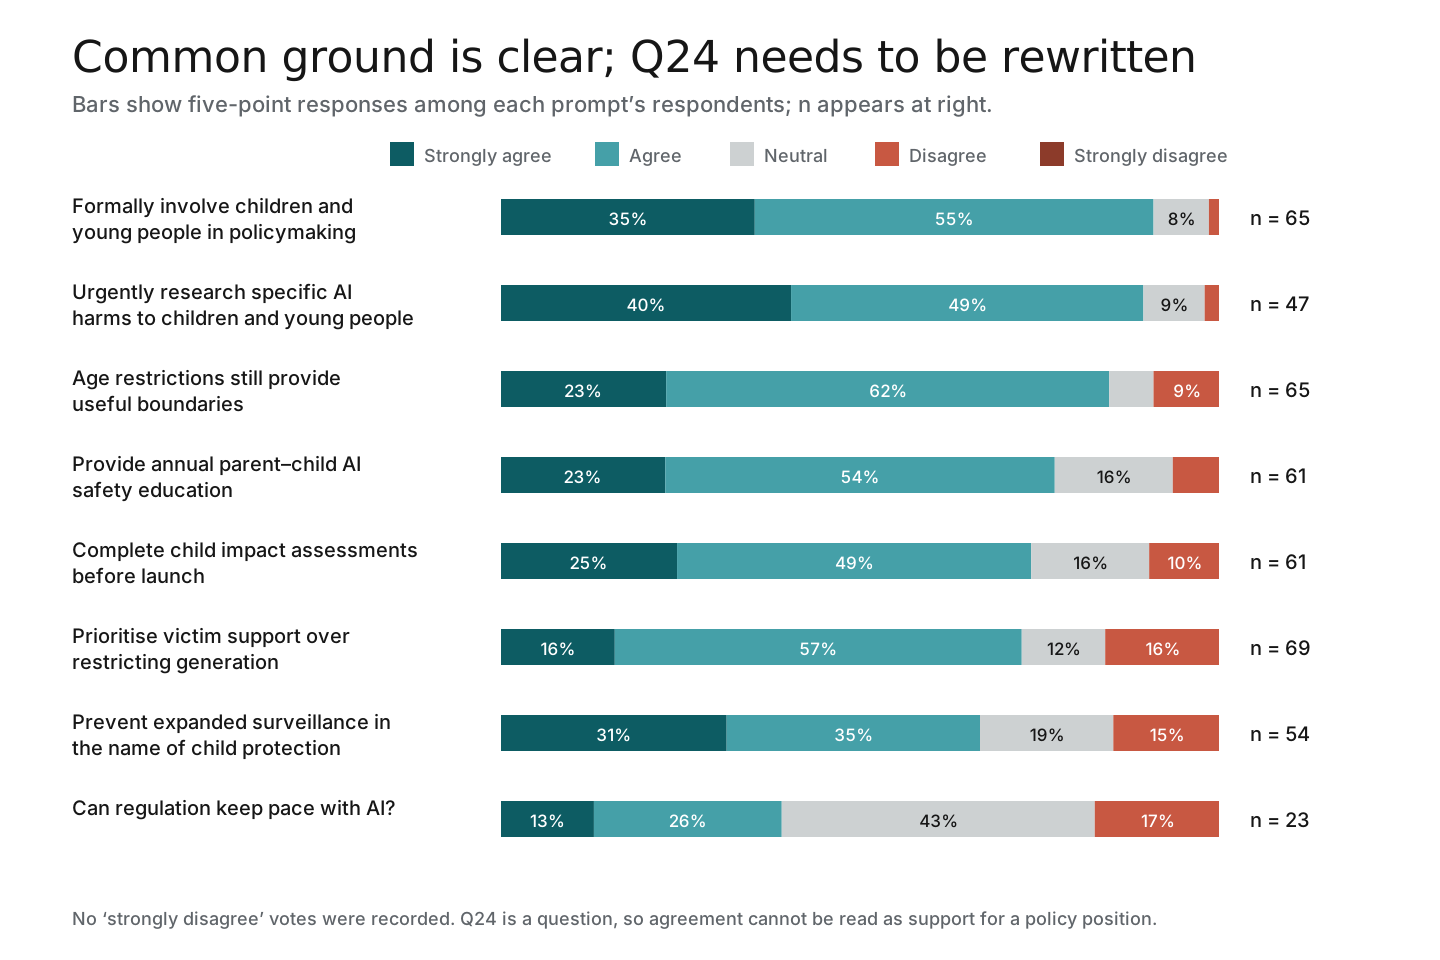
Participants most clearly backed formal youth involvement and evidence on concrete harm. These are agreements about governing well, not a mandate for one regulatory instrument.
Formal youth rolen = 65
Research concrete harmsn = 47
Age boundariesn = 65
Parent–child AI safetyn = 61
Pre-launch impact checksn = 61
Victim support firstn = 69
Prevent expanded surveillancen = 54
Can rules keep pace?n = 23
Ordered by agreement. Agree combines strongly agree and agree; response counts differ. Statement 24 is a question.
03 · Both-and priorities
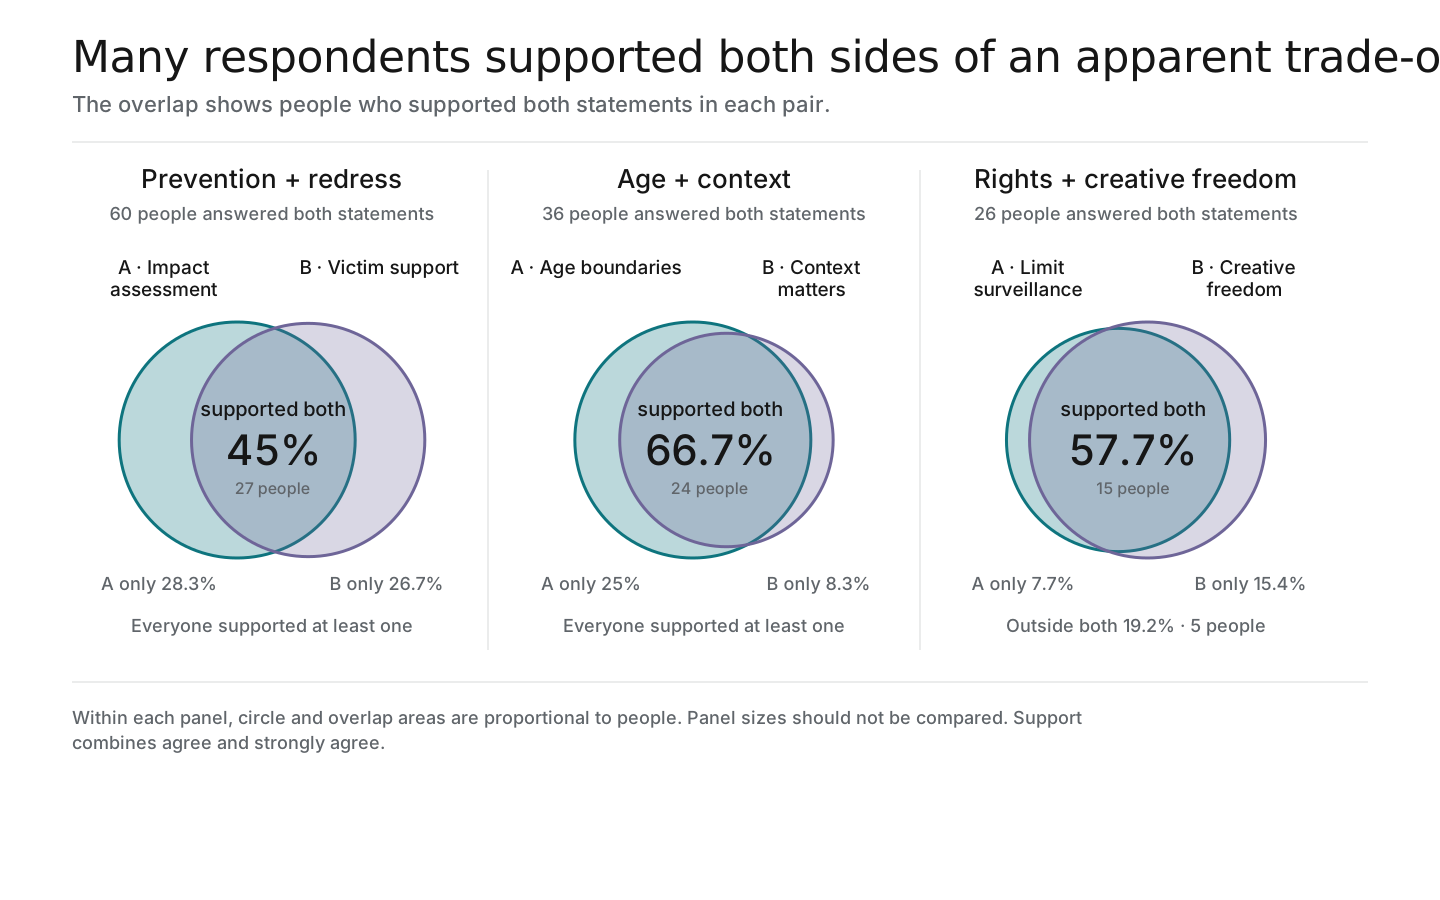
Many people supported both sides of an apparent trade-off
The overlap shows where the same respondents supported two measures that are often presented as competing choices.
A · Impact assessmentB · Victim support and redress
A only 28.3%B only 26.7%
Everyone supported at least one option
Answered both: 60A · Age boundariesB · Context matters
A only 25%B only 8.3%
Everyone supported at least one option
Answered both: 36A · Limit surveillanceB · Creative freedom
A only 7.7%B only 15.4%
Outside both: 19.2% · 5 people
Answered both: 26Circle areas are proportional within each pair. Only people who answered both statements are counted.
04 · Where evidence is thinner
Later answers are thinner evidence—and Q24 needs rewriting
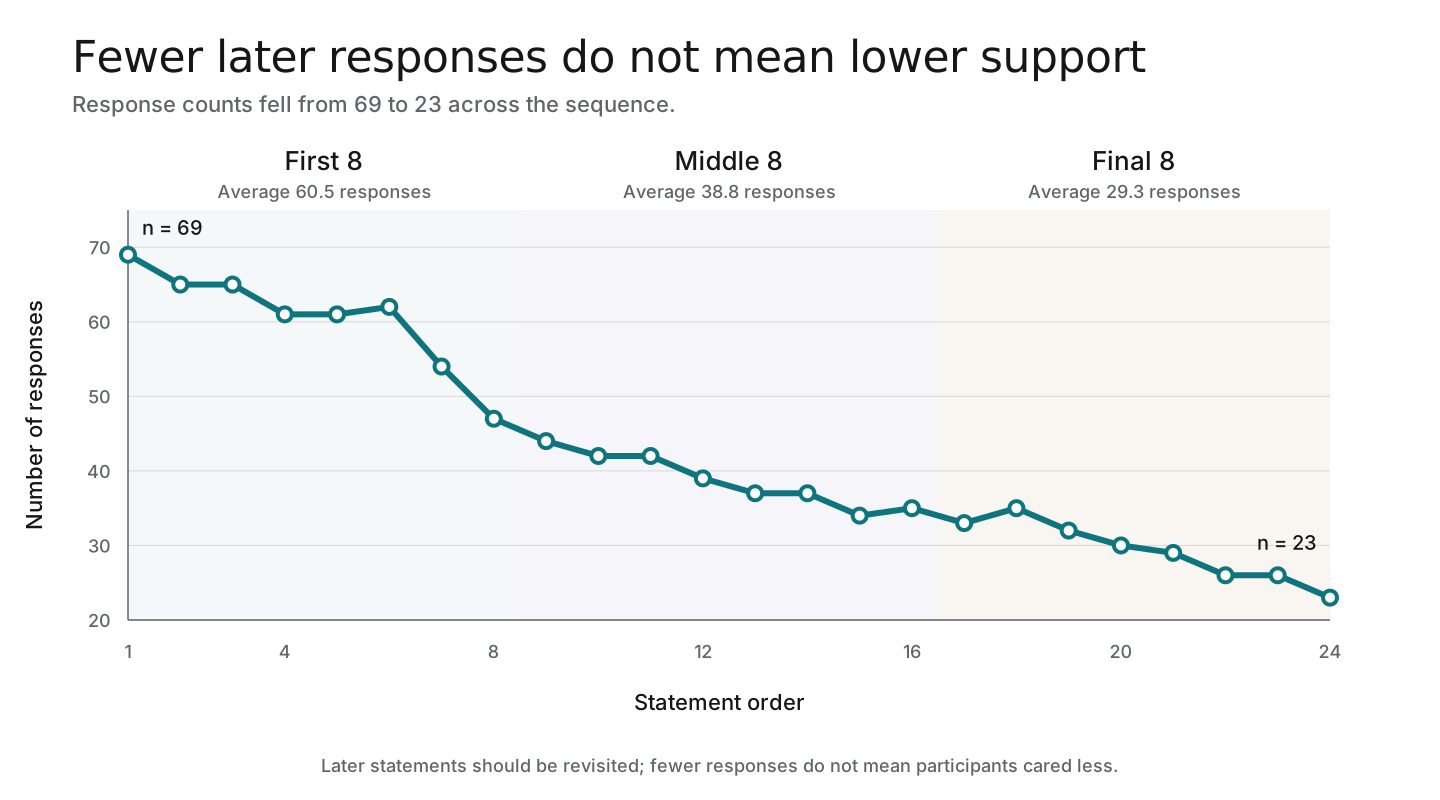
Response counts fell from 69 to 23. Before drawing substantive conclusions from later prompts, the response coverage and the wording of Q24 need attention.
average responses
First 860.5
Middle 838.8
Final 829.3
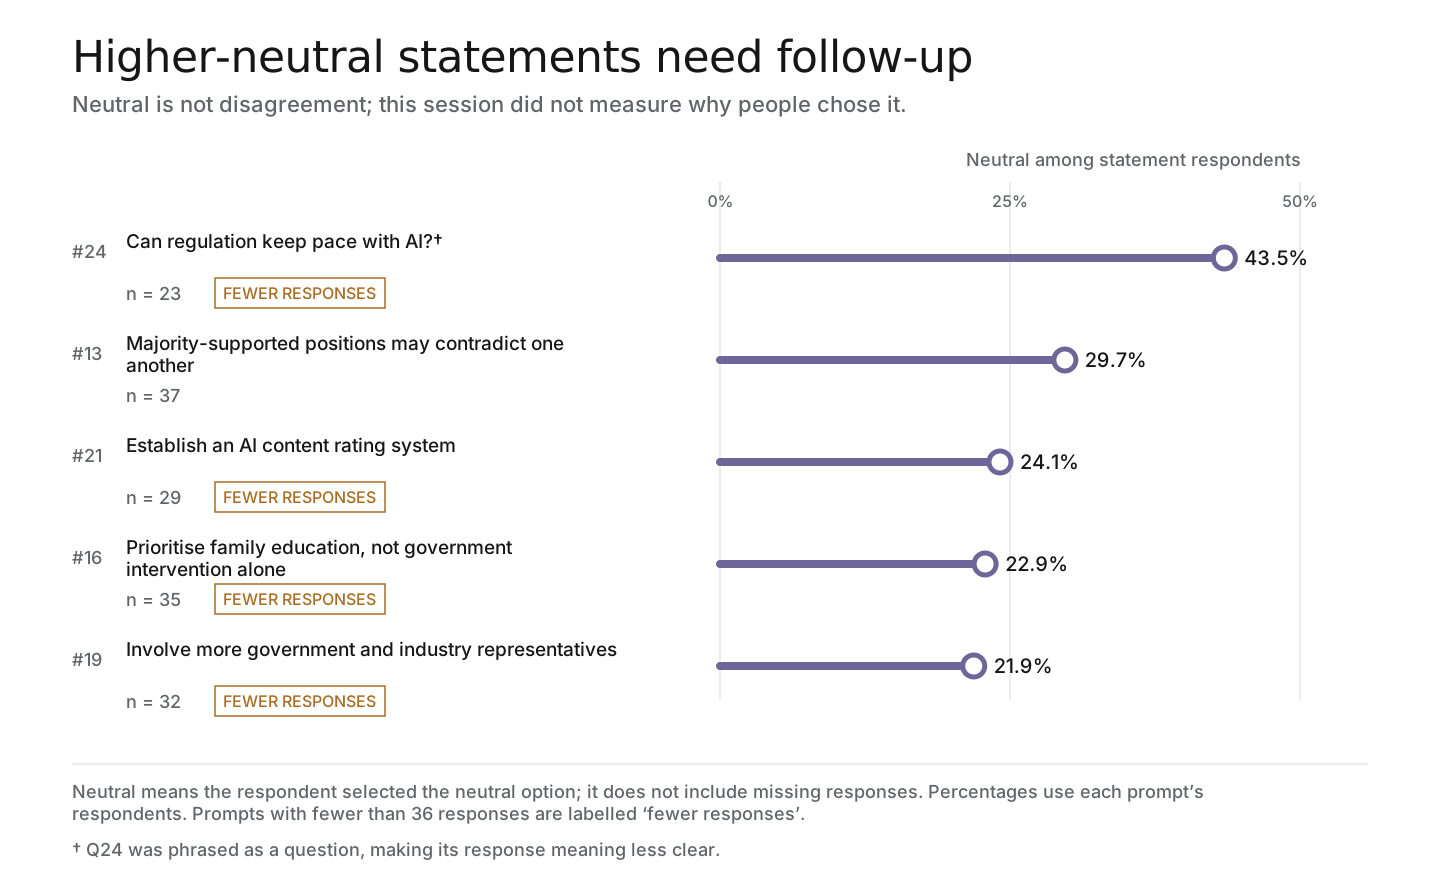
Higher-neutral statements are priorities for follow-up
Neutral is not disagreement. It marks where wording, choices or context should be revisited; the reason was not measured.
#24 Can regulation keep pace with AI?†43.5%
#13 Majority-supported positions may contradict one another29.7%
#21 Establish an AI content rating system24.1%
#16 Prioritise family education, not government intervention alone22.9%
#19 Involve more government and industry representatives21.9%
Reasons for neutral responses were not measured. † Statement 24 was phrased as a question.
05 · Opinion landscape
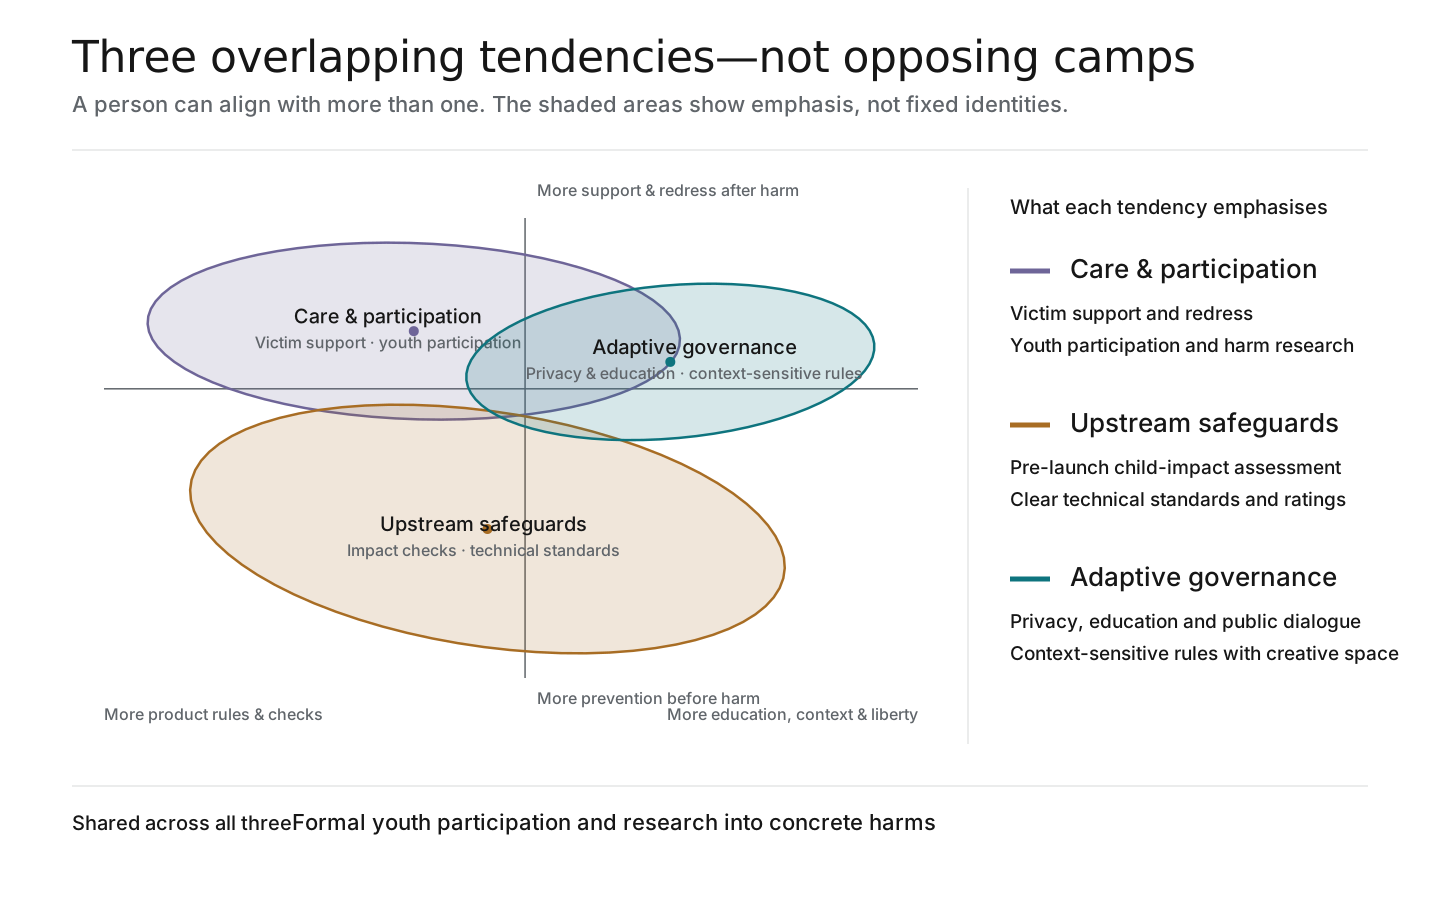
Three overlapping tendencies—not opposing camps
The clearest differences concern how to distribute attention: before and after harm, and across product rules, education, context and civil liberties. A participant can align with more than one tendency.
Care & participation
Emphasises victim support, redress and formal youth participation.
Upstream safeguards
Emphasises impact assessment, technical standards and content ratings.
Adaptive governance
Emphasises privacy, education, dialogue and context-sensitive rules.
Shared coreAll three strongly support formal youth participation and research into concrete harms.
06 · What follows
The data points to a sequence of next moves
These are practical implications from this session—not a claim to represent everyone in Taiwan.
- 01
Make youth participation structural
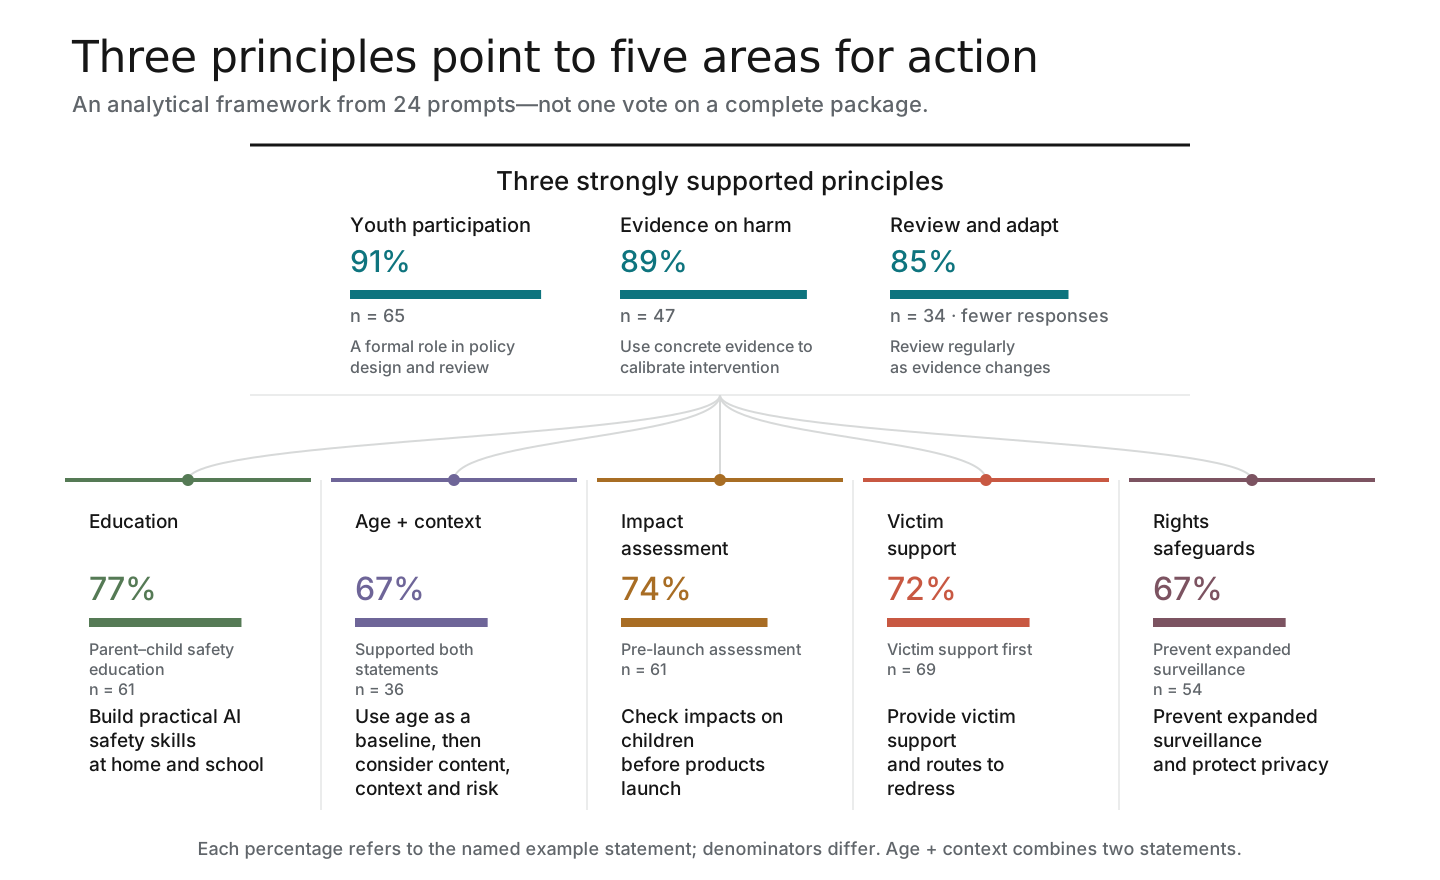
91% agreed · n = 65
Give children and young people a formal role in policy design, implementation and later review—not a one-off consultation.
- 02
Build evidence and review into the policy cycle
89% backed harm research; 85% backed regular review · n = 47 and 34
Define the harms being addressed, connect intervention strength to evidence, and schedule regular reassessment as technology changes.
- 03
Design policy packages, not forced choices
67% backed both age boundaries and context; 45% backed both prevention and redress among joint respondents
Combine age with context and risk, and pair upstream safeguards with victim support and routes to redress.
- 04
Improve the evidence before deciding the edge cases
Responses fell from 69 to 23; Q24 was 43% neutral
Rewrite Q24, revisit the later prompts, and broaden participation before treating these results as a final policy mandate.
07 · Evidence
Explore the detail when needed
Open the sections below for the step-by-step methodology, complete prompt results and chart downloads.
How this report was analysed—step by step
Open this section when you want to see how the raw responses became each chart and conclusion.
- 01
Prepare and validate the data
We checked that each participant had at most one response to each prompt and that every response used a valid scale option. The final dataset contains 71 participants with votes, 24 prompts and 1,028 responses. Names and identifiers are excluded from the report.
How to interpret itThis establishes what was analysed and prevents duplicate votes from changing the results.
- 02
Calculate each prompt’s result
Agreement combines ‘strongly agree’ and ‘agree’; disagreement combines the two disagreement options. Percentages use only the people who answered that prompt. An unanswered prompt remains missing and is never counted as neutral. Coverage is the number who answered divided by all 71 participants with votes.
How to interpret itDifferent prompts have different denominators, so later low-response prompts carry less evidence.
- 03
Organise statements into themes and principles
We compared the wording and response patterns, then grouped related statements into principles and action areas. These labels are an analyst-created synthesis; they are not an additional vote or an automated topic model. Every percentage shown still belongs to its original prompt.
How to interpret itThe themes help readers connect individual statements without inventing a new score.
- 04
Measure support for paired priorities
For each Venn diagram, we included only people who answered both prompts. A person enters the overlap when they agreed with both. Neutral and disagreement count as ‘not supported’ for this comparison. Circle areas are proportional to the four observed combinations: both, A only, B only and neither.
How to interpret itThe overlap shows whether the same respondents combined two priorities; it does not show cause or intensity.
- 05
Find the main opinion dimensions
For this step, responses are encoded as agree (+1), neutral (0) and disagree (−1), while missing remains separate. PCA uses all 71 voters to find the two strongest response gradients. Missing cells use each prompt’s observed average only while fitting the axes; personal positions use answered prompts and are adjusted for response count. The two axes explain 28.1% of the observed variation.
How to interpret itAxis names are plain-language interpretations of the statements with the strongest PCA contributions; the map is a summary of part of the variation.
- 06
Describe overlapping opinion tendencies
54 people who answered at least 7 prompts entered a three-profile fuzzy c-means analysis; 17 people did not meet that threshold. Each person receives weights across all three profiles rather than one fixed assignment. Profile positions are weighted centres, and the shaded regions show weighted spread. The regions are enlarged slightly for readability and are not confidence intervals.
How to interpret itThree profiles were chosen to keep the public map readable. Their names describe relative emphasis in this session and should not be treated as permanent identities.
- 07
Check uncertainty and limit the claims
Separately, we tested fixed K-means partitions with two to five groups and resampled the prompts 100 times. Median repeatability was 0.22; 0 runs reached the report’s 0.70 publication guardrail. We therefore publish overlapping tendencies, not participant camps. The analysis is Pol.is-inspired offline work, not official Pol.is output.
How to interpret itNo individual coordinates, profile weights or group assignments are published. Results describe this session and are not representative of everyone in Taiwan. Response counts fall from 69 to 23, no one selected ‘strongly disagree’, and Q24 is a question that does not fit the agreement scale, so those results require extra caution.
View all 24 prompts
| No. | Short label | n | Coverage | Agree | Neutral | Disagree |
|---|---|---|---|---|---|---|
| 1 | Prioritise victim support over restricting generation | 69 | 97.2% | 50 (72.5%) | 8 (11.6%) | 11 (15.9%) |
| 2 | Age restrictions still provide useful boundaries | 65 | 91.5% | 55 (84.6%) | 4 (6.2%) | 6 (9.2%) |
| 3 | Formally involve children and young people in policymaking | 65 | 91.5% | 59 (90.8%) | 5 (7.7%) | 1 (1.5%) |
| 4 | Provide annual parent–child AI safety education | 61 | 85.9% | 47 (77%) | 10 (16.4%) | 4 (6.6%) |
| 5 | Complete child impact assessments before launch | 61 | 85.9% | 45 (73.8%) | 10 (16.4%) | 6 (9.8%) |
| 6 | Treat cases with and without identifiable victims differently | 62 | 87.3% | 44 (71%) | 12 (19.4%) | 6 (9.7%) |
| 7 | Prevent expanded surveillance in the name of child protection | 54 | 76.1% | 36 (66.7%) | 10 (18.5%) | 8 (14.8%) |
| 8 | Urgently research specific AI harms to children and young people | 47 | 66.2% | 42 (89.4%) | 4 (8.5%) | 1 (2.1%) |
| 9 | Build public understanding before taking legislative action | 44 | 62% | 30 (68.2%) | 9 (20.5%) | 5 (11.4%) |
| 10 | No single standard fits people from different backgrounds | 42 | 59.2% | 31 (73.8%) | 7 (16.7%) | 4 (9.5%) |
| 11 | Prioritise education over restrictions | 42 | 59.2% | 33 (78.6%) | 5 (11.9%) | 4 (9.5%) |
| 12 | Redress matters more than prevention and enforcement | 39 | 54.9% | 31 (79.5%) | 6 (15.4%) | 2 (5.1%) |
| 13 | Majority-supported positions may contradict one another | 37 | 52.1% | 22 (59.5%) | 11 (29.7%) | 4 (10.8%) |
| 14 | Age should not be the only criterion | 37 | 52.1% | 28 (75.7%) | 7 (18.9%) | 2 (5.4%) |
| 15 | Revise policy as understanding develops | 34 | 47.9% | 29 (85.3%) | 4 (11.8%) | 1 (2.9%) |
| 16 | Prioritise family education, not government intervention alone | 35 | 49.3% | 26 (74.3%) | 8 (22.9%) | 1 (2.9%) |
| 17 | Establish clear technical standards | 33 | 46.5% | 26 (78.8%) | 4 (12.1%) | 3 (9.1%) |
| 18 | Emotional learning and interpersonal collaboration matter equally | 35 | 49.3% | 33 (94.3%) | 1 (2.9%) | 1 (2.9%) |
| 19 | Involve more government and industry representatives | 32 | 45.1% | 25 (78.1%) | 7 (21.9%) | 0 (0%) |
| 20 | Build shared understanding through education rather than compulsory rules | 30 | 42.3% | 27 (90%) | 1 (3.3%) | 2 (6.7%) |
| 21 | Establish an AI content rating system | 29 | 40.8% | 20 (69%) | 7 (24.1%) | 2 (6.9%) |
| 22 | Avoid letting political correctness constrain creative freedom | 26 | 36.6% | 19 (73.1%) | 4 (15.4%) | 3 (11.5%) |
| 23 | Verify AI-generated content, with extra care for younger children | 26 | 36.6% | 18 (69.2%) | 5 (19.2%) | 3 (11.5%) |
| 24 | Can regulation keep pace with AI? | 23 | 32.4% | 9 (39.1%) | 10 (43.5%) | 4 (17.4%) |